
Get to Know the 56 geoSmart Segments
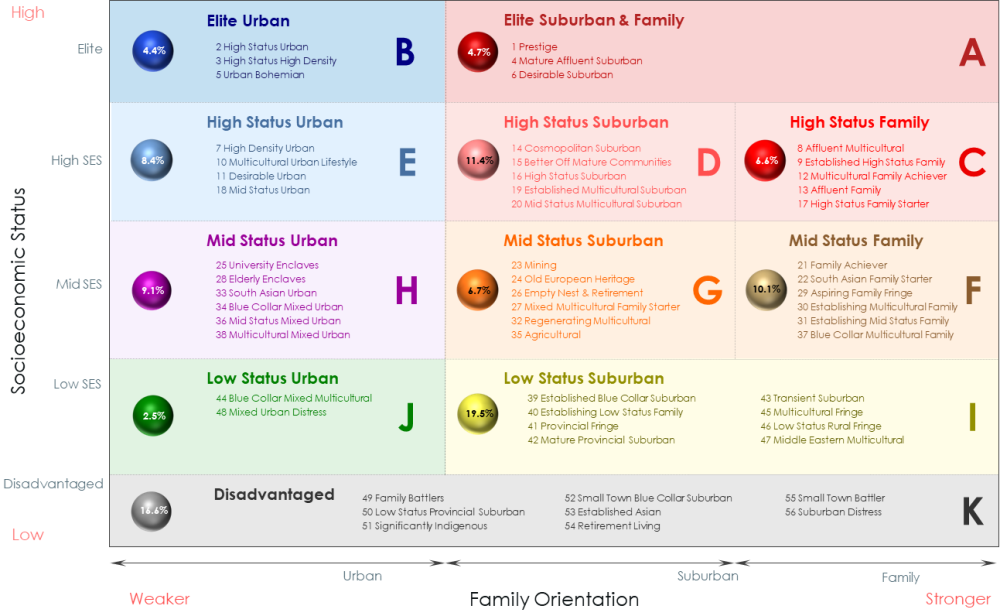
geoSmart assigns all Australian consumers and households to one of 56 segments within 11 groups.
The segments have been built to maximise differences in socioeconomic status, wallet size, spending patterns, family mix, media consumption, behavioural response and multicultural influences.
The geoSmart Segments are available through the geoTribes Explorer, Quick Append and Living Insights, as well as through media affiliates and as licensed databases. We rebuild the segments from scratch every 5 years with each new Census and validate them annually as part of our population model update.
Click on each of the geoSmart Segments for more info.
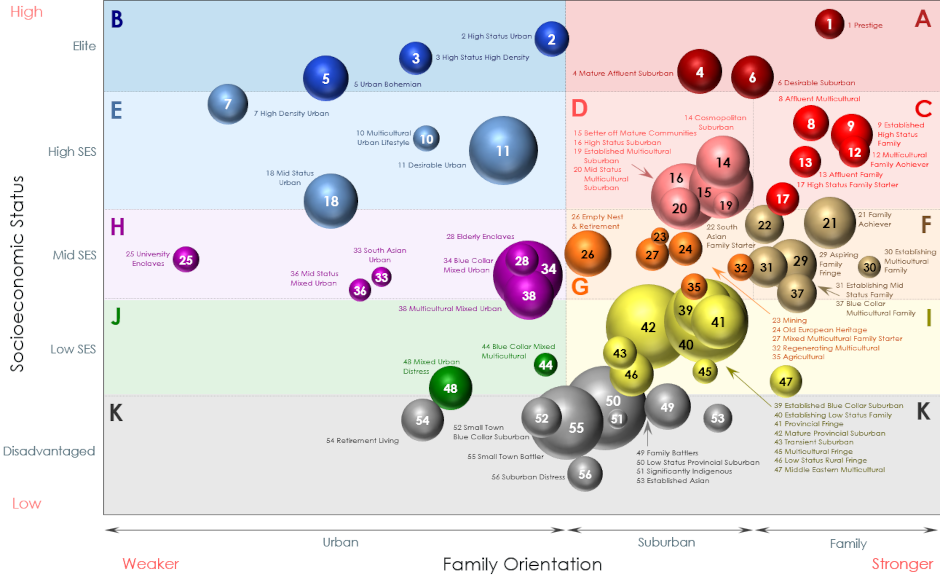
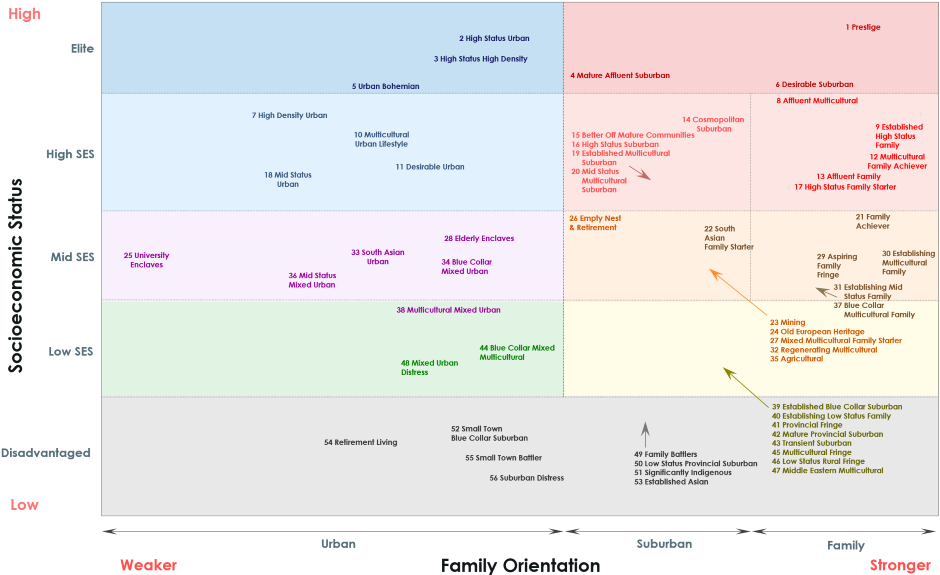


56 geoSmart Segments within 11 Groups
The 56 segments are nested within 11 groups, ranked by socioeconomic status from Group A (Elite Suburban and Family) through to Group K (Disadvantaged).
Why Use Socioeconomic Status and Family Orientation
The two most powerful drivers of why different types of people choose to live in particular places are Family Orientation and Socioeconomic Status.
Family Orientation discriminates between family areas — where there are kids, mortgages and large houses — and non-family areas, where young and older independent singles and couples choose to live. It taps into lifecycle stage, a key driver of needs across most categories.
Socioeconomic Status (SES) represents the combined effect of educational attainment, occupational status and income, and is a key driver of the spending power and quality of purchases people make to meet their needs. SES drives the price/quality trade-off that is often the most critical factor in brand positioning.
While psychographics influence consumer behaviour at the individual level, they tend to be overpowered in geospatial data by more powerful factors like spending power, cultural influences and established household expenditure patterns, all of which are integral to the geoSmart Scheme’s construction.

Segment Profiling with Rich Human Insights
The geoSmart Segments come to life with rich Human Insights profiling from our knowledge base of 700+ carefully selected variables spanning multiple dimensions.
- Motivational Psychology 47 Motivational Mindsets based on the Schwartz Values System identify the guiding principles in people’s lives — explaining brand alignment and decision-making processes.
- Lifestyle and Interests Media consumption patterns, social platform usage, sporting interests, LOHAS (Lifestyles of Health and Sustainability) behaviours, and personal activities.
- Attitudes and Concerns Sources of anxiety, buying drivers, sustainability values, and health and wellbeing priorities.
- Demographics and Economics Household composition, financial capacity, education, occupation, and cultural background.
Use our Segment Profiler or your favourite AI tool to get a deep understanding of the human factors driving customer behaviour and market performance.
Key geoSmart Applications
- Analyse Market Performance Market penetration, gap analysis, acquisition and churn, performance attribution.
- Enhance with External Data Household spend, automotive, finances, psychographics, media consumption, behaviour, brands and performance drivers.
- Profile Customer Behaviour Customer value, website visitation, products purchased, behaviour, channel usage and campaign response.
- Plan Customer Campaigns Products purchased, wallet headroom, channel usage and psychographics.
- Target External Media Nielsen CMV, Eyeota, IVE Group and the geoTribes Explorer.
Finding Your Target geoSmart Segments
The key to effective use of geoSmart is finding your best target segments — usually the big spenders in your category, or those aligned to your brand positioning.
You can find your best target geoSmart Segments by:
- Profiling your customer database through the geoTribes Living Insights and Quick Append portals
- Profiling your retail network footprint or other geographic areas with the geoTribes Explorer solution
- Using geoTribes household expenditure profiles
- Using media planning systems like CMV (Nielsen)
- Using the detailed profiling available for geoSmart to work out which segments to target
Cultural Diversity and the Ageing Population
We are currently witnessing a dramatic shift in the multicultural character of Australian consumers.
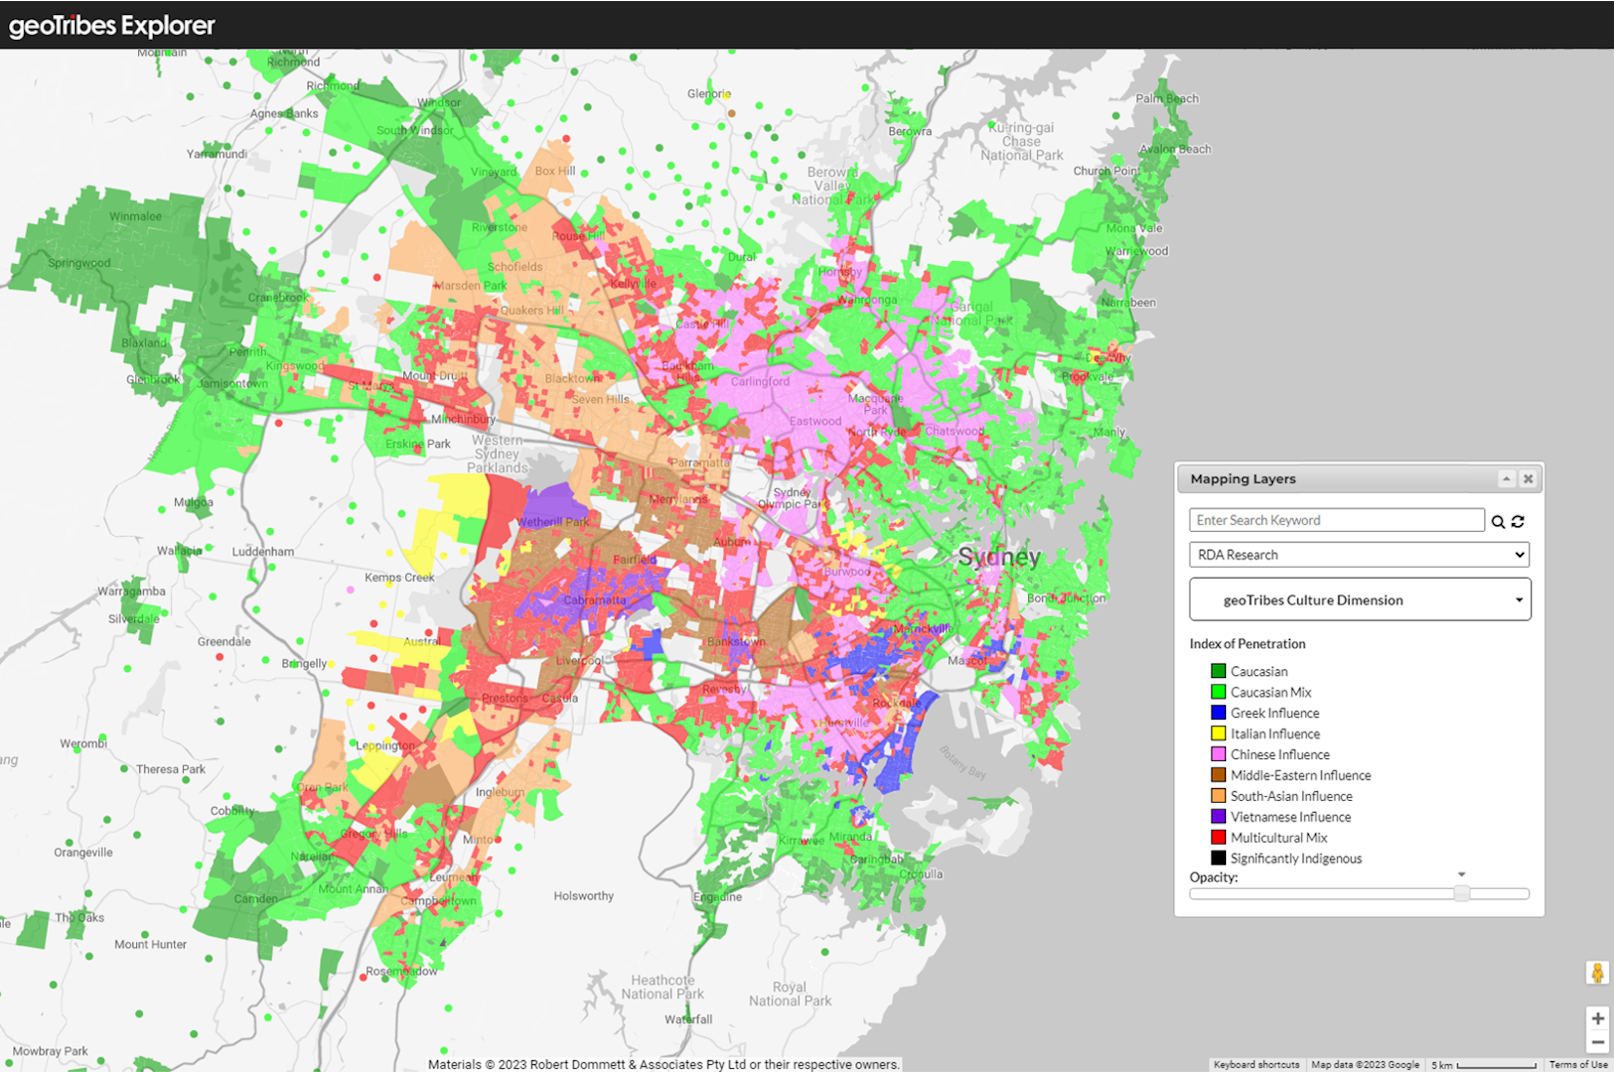
Most recently, migrants from North & South Asia have had a substantial impact on the character of areas across the country, particularly in Sydney and Melbourne but also, to a lesser extent, across metropolitan Australia.
Recent migrants from a diversity of multicultural backgrounds tend to be younger, while much of the growing boomer and retiree population is Caucasian. Cultural diversity and lifecycle change are therefore intertwined as factors in the new Australian marketplace.
geoSmart Segments are optimised to differentiate across the emerging multicultural landscape, with 24 of the 56 geoSmart Segments having a distinctive multicultural character.
Downloads
Message us
Discover how the geoSmart Segments can extend your team’s market-intelligence capabilities, with minimal investment and lead time.
Or talk to us
Cultural Diversity in Sydney
Cultural Diversity in Sydney